Gold as the Harbinger: A Century of Commodity Cycles (1928–2026)
Executive Summary
History reveals a persistent pattern in macro-finance: Gold is rarely just a shiny rock; it is the "canary in the coal mine." Since 1928, major upward revaluations in Gold have almost invariably preceded a broader secular bull market in commodities (energy, agriculture, and industrial metals).
As we navigate the economic landscape of 2026, understanding this lag effect—where Gold moves first, and commodities play catch-up—is crucial for asset allocation.
The Core Mechanism: Why Gold Leads
Before analyzing the timeline, it is vital to understand why this sequence repeats.
Monetary Debasement: Gold reacts immediately to the expansion of money supply and loss of faith in sovereign debt. It is a monetary sensor.
The Inflation Lag: Real assets (oil, copper, wheat) take longer to react because they are driven by physical supply chains and industrial demand.
The Catch-Up: Once the currency is devalued (signaled by high Gold prices), producers of commodities must charge higher nominal prices to sustain operations, triggering a "Commodity Supercycle."
Historical Echoes: Three Major Cycles
1. The Great Depression & Revaluation (1928–1934)
The Trigger: Following the stock market crash of 1929, the global economy entered a deflationary spiral.
The Gold Event: In 1933-1934, President Roosevelt effectively devalued the US Dollar by revaluing Gold from $20.67 to $35.00 per ounce (an overnight increase of ~69%).
The Commodity Reaction: This devaluation broke the deflationary grip. While it took time, commodity prices (grains, cotton, metals) bottomed and began a reflationary trend that lasted until the onset of WWII.
Insight: Gold was repriced by policy first; raw materials followed as the dollar lost purchasing power.
2. The Stagflation Era (1971–1980)
This is the most famous example of the "Gold Lead."
The Trigger: In 1971, Nixon closed the Gold Window, ending the Bretton Woods system. The USD was no longer backed by hard assets.
The Gold Event: Gold exploded from $35 in 1971 to a peak of $850 in January 1980.
The Commodity Reaction:
Oil: Quadrupled in 1973 (Embargo) and doubled again in 1979.
Agriculture: Wheat and corn prices surged in the mid-70s.
The Lag: Gold started moving aggressively in the early 70s. The broadest commodity inflation (CRB Index) peaked later, around 1980.
Insight: Investors who bought commodities after Gold made its initial breakout generated massive real returns.
3. The Emerging Market Supercycle (2000–2011)
The Trigger: The Dot-com bust and the rise of China's industrial machine.
The Gold Event: Gold bottomed around $250 in 1999/2000 and began a steady climb, breaking $1,000 in 2008 and hitting $1,920 in 2011.
The Commodity Reaction: Oil lagged Gold initially but eventually surged to $147/barrel in 2008. Copper and Iron Ore hit all-time highs after Gold had already established a bull trend.
Insight: Gold signaled the weak dollar (post-2001 cuts), but China’s physical demand drove the commodity catch-up.
The Current Cycle: The "Great Debasement" (2020–2026)
We are currently living through the fourth major iteration of this pattern.
Phase 1: The Monetary Shock (2020–2021)
The COVID-19 stimulus injected trillions into the global economy. Gold reacted by hitting new highs (crossing $2,000) in August 2020, signaling that the currency had been diluted.
Phase 2: The Inflationary Spike & Geopolitics (2022–2024)
While Gold consolidated, commodities (Oil, Gas, Wheat) spiked due to the Russia-Ukraine war and supply chain breaks. However, central banks raised rates, temporarily suppressing commodity prices in 2023.
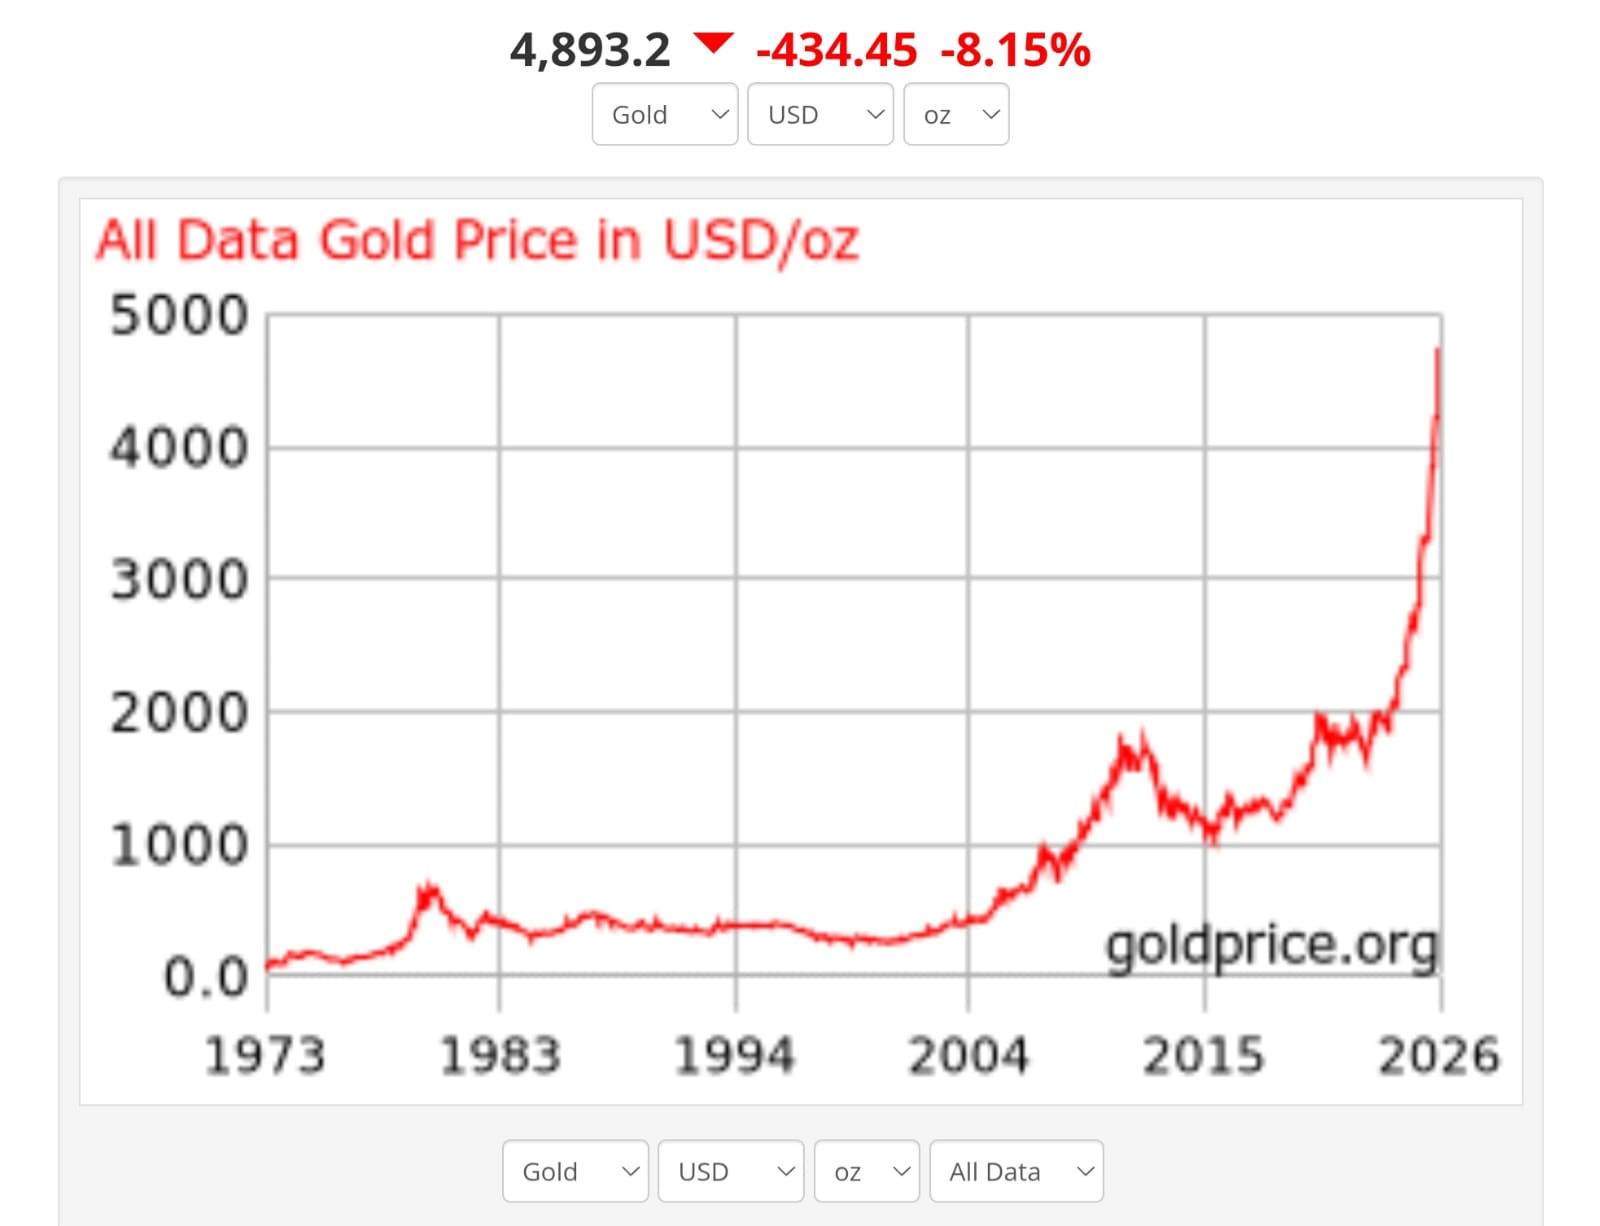
Phase 3: The Breakout & Divergence (2024–2026) Gold's Behavior: Throughout late 2024 and 2025, Gold aggressively broke past historical resistance ($2,100, $2,400, and beyond), driven by central bank buying (China, Poland, Singapore) and fears of US debt sustainability. The Anomaly: As of early 2026, while Gold is at or near record highs, many industrial commodities (specifically energy and base metals) have remained relatively cheap compared to historical ratios.
Source: goldprice.org
What History Says Comes Next (2026 Outlook)
If the 1970s and 2000s are the roadmap, we are currently in the "Catch-Up" window.
The Gold-to-Oil Ratio: Historically, this ratio reverts to mean. With Gold high and Oil stabilized, Oil is mathematically "cheap" in gold terms.
The Rotation: Capital often rotates from the "safety" of Gold into the "risk" of cyclical commodities once inflation expectations become entrenched.
Silver's Role: Silver usually acts as the bridge. It is both a monetary metal (like Gold) and an industrial metal (like Copper). In 2026, we are seeing Silver act with high volatility, often a precursor to a broader industrial commodity move.
Investment Action Plan
Based on historical repetitions from 1928 to 2026, here is the strategic insight:
Asset Class
Historical Status
2026 Insight
Gold
Leading Indicator
Likely remains in a secular uptrend but may pause/consolidate. It has done its job of signaling currency weakness.
Silver
The Lagging High-Beta
Historically outperforms Gold in the second half of the cycle. Look for industrial demand (Green Energy/AI hardware) to drive this.
Energy (Oil/Gas)
The Catch-Up Play
Often undervalued relative to Gold at this stage. Supply constraints (underinvestment in capex) make this a strong hedge.
Copper/Metals
The Economy Play
If global liquidity rises to support debt (lowering rates), hard assets like Copper tend to surge to close the gap with Gold prices.
Conclusion
The history of the last 98 years (1928–2026) teaches us one clear lesson: Gold marks the change in the value of money; Commodities mark the change in the cost of living.
We have already seen the change in the value of money (Gold soaring). The "cost of living" adjustment in raw materials usually follows. A diversified portfolio in 2026 should not just hold Gold, but should look closely at the tangible assets that have not yet repriced to reflect the new monetary reality.
Ringkasan Eksekutif
Sejarah mengungkap pola yang berulang dalam makro-keuangan: Gold jarang sekadar logam mengkilap; ia adalah "burung kenari di tambang batu bara." Sejak 1928, revaluasi besar-besaran Gold ke atas hampir selalu mendahului bull market sekular yang lebih luas dalam komoditas (energi, pertanian, dan logam industri).
Saat kita menavigasi lanskap ekonomi 2026, memahami efek jeda ini—di mana Gold bergerak lebih dahulu, dan komoditas menyusul—adalah hal yang krusial untuk alokasi aset.
Mekanisme Inti: Mengapa Gold Memimpin
Sebelum menganalisis linimasa, penting untuk memahami mengapa urutan ini terus berulang.
Penurunan Nilai Mata Uang (Monetary Debasement): Gold bereaksi segera terhadap ekspansi jumlah uang beredar dan hilangnya kepercayaan terhadap utang negara. Ia adalah sensor moneter.
Jeda Inflasi: Aset riil (minyak, tembaga, gandum) membutuhkan waktu lebih lama untuk bereaksi karena didorong oleh rantai pasokan fisik dan permintaan industri.
Efek Kejar-Kejaran: Setelah mata uang terdevaluasi (yang disinyalkan oleh harga Gold yang tinggi), produsen komoditas harus menaikkan harga nominal untuk mempertahankan operasional, sehingga memicu "Supercycle Komoditas."
Gema Sejarah: Tiga Siklus Besar
1. Depresi Besar & Revaluasi (1928–1934)
Pemicunya: Menyusul crash pasar saham 1929, ekonomi global masuk ke dalam spiral deflasi.
Peristiwa Gold: Pada 1933–1934, Presiden Roosevelt secara efektif mendevaluasi Dolar AS dengan merevaluasi Gold dari $20,67 menjadi $35,00 per ons (kenaikan seketika sekitar 69%).
Reaksi Komoditas: Devaluasi ini memutus cengkeraman deflasi. Meski butuh waktu, harga komoditas (biji-bijian, kapas, logam) mencapai titik bawah dan memulai tren reflasi yang berlanjut hingga pecahnya Perang Dunia II.
Insight: Gold pertama kali dihargai ulang melalui kebijakan; bahan baku menyusul seiring dolar kehilangan daya belinya.
2. Era Stagflasi (1971–1980)
Ini adalah contoh paling terkenal dari "Gold Memimpin."
Pemicunya: Pada 1971, Nixon menutup "Gold Window," mengakhiri sistem Bretton Woods. USD tidak lagi didukung oleh aset keras.
Peristiwa Gold: Gold meledak dari $35 pada 1971 ke puncak $850 pada Januari 1980.
Reaksi Komoditas:
Minyak: Melonjak empat kali lipat pada 1973 (Embargo) dan naik dua kali lipat lagi pada 1979.
Pertanian: Harga gandum dan jagung melonjak tajam di pertengahan tahun 70-an.
Jeda: Gold mulai bergerak agresif di awal tahun 70-an. Inflasi komoditas yang paling luas (Indeks CRB) mencapai puncaknya belakangan, sekitar 1980.
Insight: Investor yang membeli komoditas setelah Gold melakukan breakout awal menghasilkan imbal hasil riil yang masif.
3. Supercycle Pasar Berkembang (2000–2011)
Pemicunya: Kehancuran Dot-com dan kebangkitan mesin industri China.
Peristiwa Gold: Gold mencapai titik bawah sekitar $250 pada 1999/2000 dan memulai pendakian yang stabil, menembus $1.000 pada 2008 dan menyentuh $1.920 pada 2011.
Reaksi Komoditas: Minyak awalnya tertinggal dari Gold tetapi akhirnya melonjak ke $147/barel pada 2008. Tembaga dan Bijih Besi mencapai rekor tertinggi sepanjang masa setelah Gold sudah menetapkan tren bull.
Insight: Gold mensinyalkan dolar yang lemah (pasca-pemotongan suku bunga 2001), tetapi permintaan fisik China mendorong kejar-kejaran komoditas.
Siklus Saat Ini: "Debasement Besar" (2020–2026)
Kita saat ini sedang menjalani iterasi keempat dari pola ini.
Fase 1: Guncangan Moneter (2020–2021)
Stimulus COVID-19 menyuntikkan triliunan dolar ke dalam perekonomian global. Gold bereaksi dengan mencetak rekor tertinggi baru (melewati $2.000) pada Agustus 2020, menandakan bahwa mata uang telah terdilusi.
Fase 2: Lonjakan Inflasi & Geopolitik (2022–2024)
Sementara Gold konsolidasi, komoditas (Minyak, Gas, Gandum) melonjak akibat perang Rusia-Ukraina dan gangguan rantai pasokan. Namun, bank sentral menaikkan suku bunga, yang untuk sementara menekan harga komoditas pada 2023.
Fase 3: Breakout & Divergensi (2024–2026) Perilaku Gold: Sepanjang akhir 2024 dan 2025, Gold secara agresif menembus resistansi historis ($2.100, $2.400, dan seterusnya), didorong oleh pembelian bank sentral (China, Polandia, Singapura) dan kekhawatiran atas keberlanjutan utang AS. Anomali: Per awal 2026, sementara Gold berada di atau mendekati rekor tertinggi, banyak komoditas industri (khususnya energi dan logam dasar) masih relatif murah dibandingkan rasio historis.
Sumber: goldprice.org
Apa yang Dikatakan Sejarah tentang Kelanjutannya (Outlook 2026)
Jika dekade 1970-an dan 2000-an adalah peta jalannya, kita saat ini berada dalam jendela "Kejar-Kejaran."
Rasio Gold-terhadap-Minyak: Secara historis, rasio ini bergerak kembali ke rata-rata. Dengan Gold yang tinggi dan Minyak yang stabil, Minyak secara matematis "murah" dalam satuan Gold.
Rotasi: Modal sering berotasi dari "keamanan" Gold ke "risiko" komoditas siklus begitu ekspektasi inflasi mulai mengakar.
Peran Silver: Silver biasanya bertindak sebagai jembatan. Ia adalah logam moneter (seperti Gold) sekaligus logam industri (seperti Tembaga). Pada 2026, kita melihat Silver bergerak dengan volatilitas tinggi, yang seringkali menjadi pendahulu pergerakan komoditas industri yang lebih luas.
Rencana Aksi Investasi
Berdasarkan pola berulang dari 1928 hingga 2026, berikut adalah insight strategisnya:
Kelas Aset
Status Historis
Insight 2026
Gold
Indikator Pemimpin
Kemungkinan tetap berada dalam tren naik sekular tetapi bisa jeda/konsolidasi. Ia telah menjalankan fungsinya sebagai sinyal pelemahan mata uang.
Silver
High-Beta yang Tertinggal
Secara historis mengungguli Gold di paruh kedua siklus. Cermati permintaan industri (Energi Hijau/hardware AI) sebagai penggeraknya.
Energi (Minyak/Gas)
Permainan Kejar-Kejaran
Seringkali undervalued relatif terhadap Gold pada tahap ini. Keterbatasan pasokan (underinvestasi capex) menjadikannya hedging yang kuat.
Tembaga/Logam
Permainan Ekonomi
Jika likuiditas global meningkat untuk mendukung utang (penurunan suku bunga), aset keras seperti Tembaga cenderung melonjak untuk menutup kesenjangan dengan harga Gold.
Kesimpulan
Sejarah 98 tahun terakhir (1928–2026) mengajarkan satu pelajaran yang jelas: Gold menandai perubahan nilai uang; Komoditas menandai perubahan biaya hidup.
Kita telah menyaksikan perubahan nilai uang (Gold melonjak). Penyesuaian "biaya hidup" pada bahan baku biasanya menyusul. Portofolio yang terdiversifikasi di 2026 tidak seharusnya hanya memegang Gold, tetapi harus mencermati aset-aset nyata yang belum dihargai ulang untuk mencerminkan realitas moneter yang baru.